Subtotal: ₦1,692,350.00

hi guys it’s sensors Monday!
Sensors Monday is where we pick a random sensor from the hub360 stock and post an how to use tutorial about it.
Today we will be talking about the AD8232 heart rate sensor and as described in the headline, we will do the visualization using the Arduino serial plotter which is available in all Arduino IDE from version 1.6.7 upwards, Processing and MATLAB so the scientific folks can also get a feel of how to integrate the Arduino with MATLAB.
About AD8232
The AD8232 is a neat little chip used to measure the electrical activity of the heart. It is designed to extract, amplify, and filter small bio-potential signals in the presence of noisy conditions, such as those created by motion or remote electrode placement.
This electrical activity can be charted as an ECG or Electrocardiogram which is used to help diagnose various heart conditions. you can read more about ECG here.
for this tutorial we will be working with the following components.
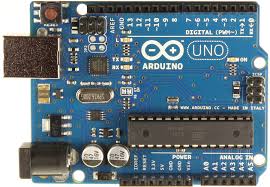
1. Arduino UNO (or any other variation)
2. The ad8232 heart beat monitor.
These are the main things needed for this tutorial. You can add any other thing to get different kind of result for instance a buzzer to raise alarm when it gets to particular level etc.
Schematics
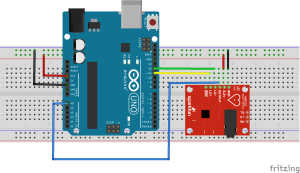
First thing first, lets connect our hardware.
Software
Since we will basically be using 3 softwares for this project that is the arduino IDE, MATLAB and Processing. The reason for introducing MATLAB is to allow people who plan to use the arduino for more scitentific purposes and may need to connect it to MATLAB get a firsthand feel of how it can be done. Asides connecting the arduino to matlab via serial Port, the arduino can also be programmed with Matlab with the help of the Matlab Arduino IO hardware support package.
Arduino Code.
First thing first is to run the code below in your arduino IDE by copying and pasting it in the IDE.
There are already several tutorials on this website that will guide you on how to do that if you dont know already.
int loPin = 11
int lnPin = 12
int ECGout = A0
void setup() {
// initialize the serial communication:
Serial.begin(9600);
pinMode(loPin, INPUT); // Setup for leads off detection LO +
pinMode(lnPin, INPUT); // Setup for leads off detection LO –
}
void loop()
{
if((digitalRead(loPin) == 1)||(digitalRead(lnPin) == 1))
{
Serial.println(‘!’);
}
else
{
// send the value of analog input 0:
Serial.println(analogRead(ECGout));
}
//Wait for a bit to keep serial data from saturating
delay(5);
}
Upload the Code to your Arduino and attach the probes for the ad8232 in the manner depicted in the image below.
All done? then the next thing is visualizing the data. we are going to explore three ways for you to visualize the ECG/EKG data.
1. Using the Arduino Serial Monitor
Recent versions of the Arduino IDE provides the opportunity for you to not just view the numbers but also to plot the data which is good for us in our case as it enables us view the ECG graph.
After uploading the Arduino code the board, click on tools and then serial plotter. It will give you a real time plot of the ECG/EKG signal.
2. MATLAB
MATLAB is known as the language of technical computing a very good tool for advanced data analysis. If you want to know more just head down to their site. The assumption on which my adding this to the tutorial is based,is that most of the people who would want to visualize the data with MATLAB will be familiar with its environment so I will just go straight to it.
Just like most programming tools, MATLAB also has a serial port connection for communication with other software and devices and that’s what we will use to communicate between the Arduino and MATLAB.
Simply create a new script and paste the following code in it.
s = serial(‘COM1’); %this create the serial object. COM1 is the COM port to which your Arduino is connected.
fopen(s); % this opens the serial port and prepares it for communication
out = fread(s); %This reads data from the serial port
Plot(out) % // Plot the received data
Save and run it and you will see your sensor data being graphed in real time.
3. Processing
Processing is closely related to the Arduino IDE. It was one of the programming tools on which the arduinoIDE was based. Its major applicatipn is for visualization and artistry.
Just like for MATLAB i won’t be going deep into how processing works. downloading the processing software and getting more information can be found on their website.
To use this method to visualize, copy the code below and paste it into your processing IDE ensuring the com port number matches the one to which your own Arduino is connected. You must also ensure none of the technique mentioned above is running so you don’t get errors as the serial port can only handle communication between two folks at the same time.
The code below works with the Processing IDE v2.2.1. it may not work with newer versions so ensure you download the correct version from the download page on their website.
//import the serial library
import processing.serial.*;
Serial comPort; // The serial port
int Pos = 1; // horizontal position of the graph
float posold = 0;
float posnew = 0;
float inByte = 0;
void setup () {
// set the window size:
size(1000, 400);
// List all the available serial ports
println(Serial.list());
// Open whatever port is the one you’re using.
comPort = new Serial(this, Serial.list()[2], 9600);
// don’t generate a serialEvent() unless you get a newline character:
comPort.bufferUntil(‘\n’);
// set inital background:
background(0xff);
}
void draw () {
// everything happens in the serialEvent()
}
void serialEvent (Serial myPort) {
// get the ASCII string:
String inString = comPort.readStringUntil(‘\n’);
if (inString != null) {
// trim off any whitespace:
inString = trim(inString);
// If leads off detection is true notify with blue line
if (inString.equals(“!”)) {
stroke(0, 0, 0xff); //Set stroke to blue ( R, G, B)
inByte = 512; // middle of the ADC range (Flat Line)
}
// If the data is good let it through
else {
stroke(0xff, 0, 0); //Set stroke to red ( R, G, B)
inByte = float(inString);
}
// to plot
inByte = map(inByte, 0, 1023, 0, height);
posnew = height – inByte;
line(Pos – 1, posold, Pos, posnew);
posold = posnew;
// to start again after getting to the end
if (Pos >= width) {
Pos = 0;
background(0xff);
}
else {
// increment the horizontal position:
Pos++;
}
}
}
if the processing sketch is giving you issues, You may need to check this part of the code:
comPort = new Serial(this, Serial.list()[2], 9600);
You may need to change the parameter inside Serial.list()[N] so as to choose the right port to which your arduino is connected. A List of available COM ports will appear in the lower portion of the sketch window. Remember that COM port selection begins at 0. Typically your Arduino will appear as the highest COM number if it is the only device connected to your computer.
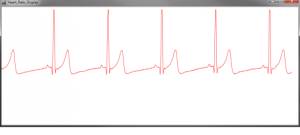
through the eyes of processing, my heart rate looks like this….
That’s it guys. Let , me know if you have any questions as usual will be glad to help. Have a great week!
cheers,
Emmanuel Odunlade
Learning Lead
Hub360








i have a signal but not a same your signal. help me